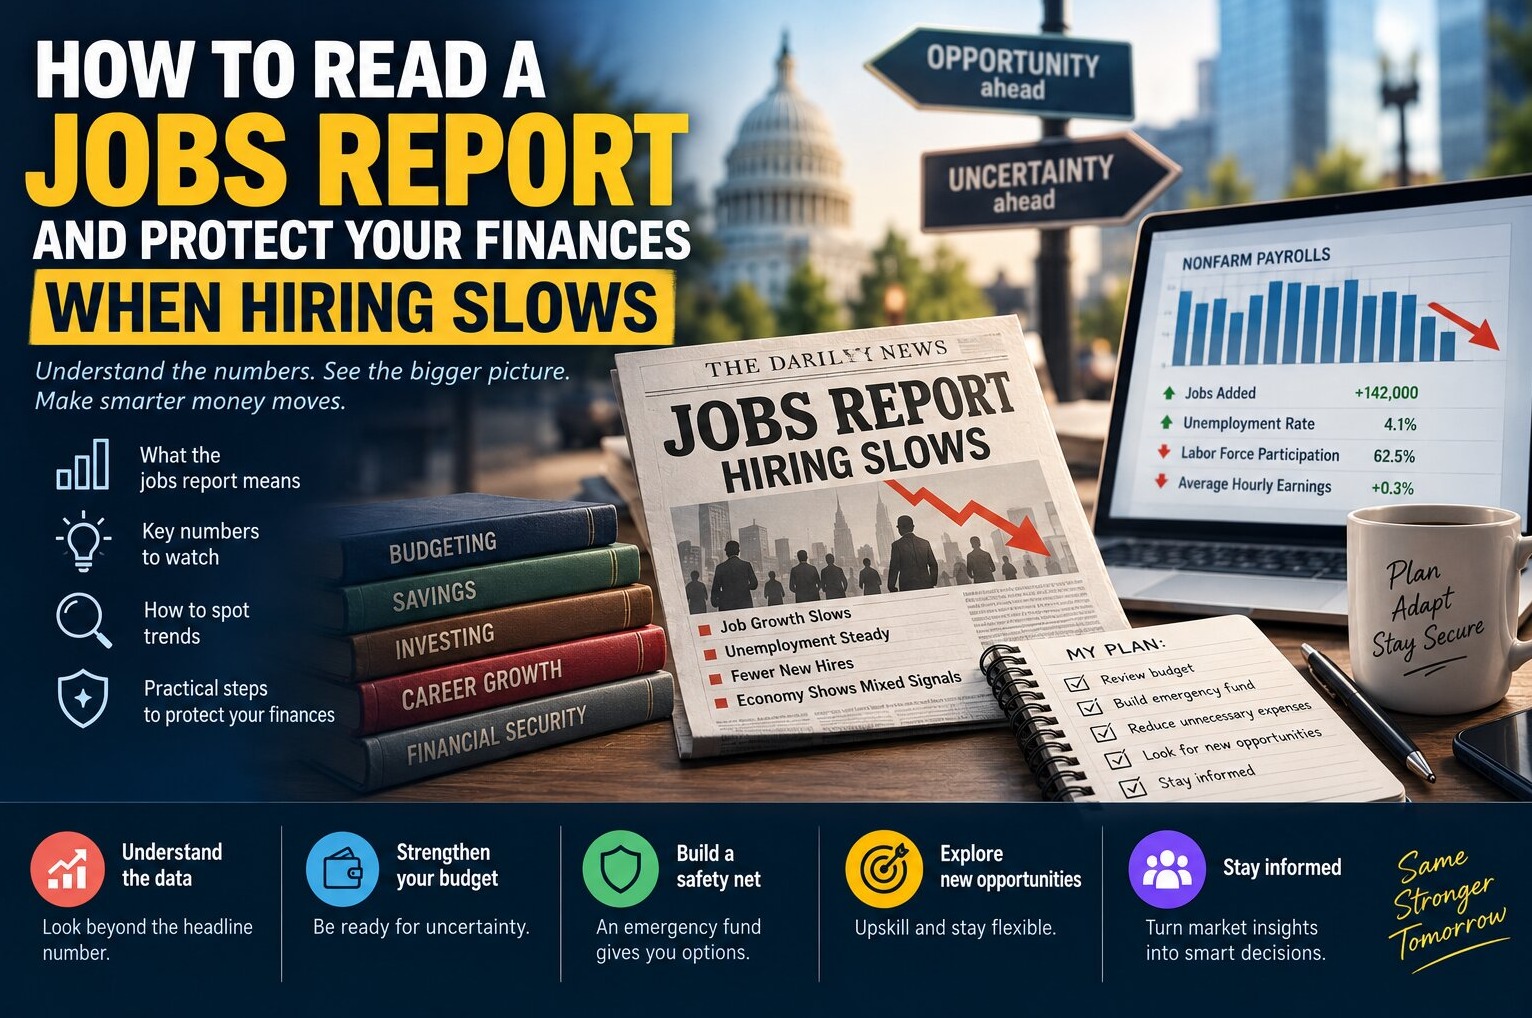
The U.S. economy lost 23,000 jobs in July 2026, the Bureau of Labor Statistics reported on August 7 — a stunning miss against the roughly 85,000 gain economists had penciled in. The unemployment rate actually ticked down to 4.1% from 4.2% in June, but not because hiring picked up. The labor force shrank by 264,000 people, pushing the participation rate to 61.4%, its lowest level since early 2021. BLS also revised May and June payrolls down by a combined 103,000 jobs, meaning the slowdown had been building for months before anyone noticed.
The Federal Reserve, meeting July 28–29, held its benchmark rate at 3.50%–3.75%, with several officials pushing for a cut given the softening labor market. The August jobs report lands September 4, and whatever it shows will shape whether the Fed moves at its next meeting. If you're outside the U.S., the same story is playing out with local variations: the UK's unemployment rate sits at 4.9% for March–May 2026, Australia's climbed to 4.5% in July, and Canada's is running much hotter at 6.4%. None of these numbers, on their own, tell you what to do. This guide walks through how to actually read a jobs report, what it means for your rates and your job security, and the concrete steps to take while hiring is soft.
How to Read a Jobs Report Like Someone Who Actually Understands It
Most people skim past three numbers — the unemployment rate, the payroll change, and a vague sense of whether it was "good" or "bad." That's not enough to make decisions with. A useful read requires looking at four figures together, because any one of them in isolation can mislead you. July 2026 is a textbook case: the headline unemployment rate fell, which sounds positive, but it fell because people stopped looking for work, not because more people found jobs.
Here's what each figure actually captures and what July's report showed:
| Indicator | July 2026 Reading | What It Measures | Why It Matters to You |
|---|---|---|---|
| Unemployment rate | 4.1% (down from 4.2%) | Share of the labor force actively seeking work | Can fall for the wrong reason — check participation before celebrating |
| Nonfarm payrolls | -23,000 | Net jobs added or lost across the economy | The clearest single signal of hiring momentum |
| Labor force participation | 61.4% (lowest since early 2021) | Share of working-age people employed or job-hunting | A falling rate often means discouraged workers, not a healthier market |
| Prior-month revisions | -103,000 (May + June combined) | Corrections to earlier payroll estimates | Large downward revisions signal the slowdown started earlier than headlines suggested |
The revisions column is the one most readers skip, and it's often the most honest number in the release. BLS payroll estimates are based on survey samples that get revised twice as more complete data comes in. When two consecutive months get revised down by triple digits, it means the economy was already cooling in May and June while the initial reports made it look stable.
What Weak Job Growth Means for Your Wallet
Jobs data feeds directly into two things that touch your finances: Federal Reserve policy and your own job security. The Fed's dual mandate is price stability and maximum employment, so a weakening labor market pushes committee members toward cutting rates even if inflation isn't fully tamed. That's exactly the tension playing out now — the Fed held steady in July, but a soft August report would make the case for a cut much stronger heading into the fall meetings.
If the Fed does start cutting, the effects show up unevenly. Savings account and CD yields tend to fall first, since banks reprice deposit rates quickly. Mortgage rates move more on long-term bond yields and expectations than the fed funds rate itself, but they typically drift lower when the market expects a cutting cycle. Credit card APRs, which are usually pegged to the prime rate, adjust close to one-for-one with Fed moves, so carrying a balance gets slightly cheaper. None of this happens overnight, and none of it should be the reason you make a major financial decision — but it's useful context for timing a refinance or locking in a savings rate.
The more immediate issue for most readers is sector-specific risk. July's losses were concentrated: government payrolls fell by 53,000, leisure and hospitality by 40,000, and retail by 14,000. Meanwhile, private education and health services added 25,000 jobs and construction added 22,000. If you work in a sector on the losing side of that list, the jobs report is telling you something you can act on directly, not just an abstract economic indicator.
Step-by-Step: Building a Financial Buffer While Hiring Is Soft
You don't need to panic over one weak report, but a stretch of downward revisions and a shrinking labor force is a reasonable trigger to tighten up your financial position. Here's a practical sequence:
- Check your emergency fund against your actual monthly burn. Aim for three to six months of essential expenses in a liquid, FDIC- or FSCS-insured account; if your industry is in one of the shrinking sectors above, lean toward six.
- Audit which of your income sources are tied to discretionary spending. Retail, hospitality, and leisure roles are typically first to feel cuts when consumers pull back, so income from those sectors deserves a bigger buffer than a role in healthcare or utilities.
- Hold off on new variable-rate debt until the rate picture clarifies. If a Fed cut looks likely in the next few months, locking into a long-term fixed rate now for a car loan or personal loan may cost you more than waiting.
- Update your resume and LinkedIn profile before you need them. Recruiters and hiring managers move faster when your materials are already current; scrambling to update a resume during a layoff wastes days you don't have.
- Diversify income if you can. A side hustle or freelance channel doesn't need to replace a full salary, but even a few hundred dollars a month reduces how much a single layoff can hurt you.
- Re-check your health insurance options. If your coverage is tied to your employer and your sector is contracting, understand your COBRA costs or marketplace alternatives before you need them, not after.
How Employment Statistics Compare Across Tier 1 Countries
If you live outside the U.S., the BLS jobs report isn't your report — but the same discipline of reading beyond the headline number applies everywhere. Each country publishes its own release on its own schedule, using its own agency and its own definitions, and the numbers aren't always comparable one-to-one.
| Country | Agency | Latest Unemployment Rate | Release Frequency |
|---|---|---|---|
| United States | Bureau of Labor Statistics (BLS) | 4.1% (July 2026) | Monthly, first Friday |
| United Kingdom | Office for National Statistics (ONS) | 4.9% (Mar–May 2026) | Monthly, rolling 3-month average |
| Canada | Statistics Canada | 6.4% (July 2026) | Monthly Labour Force Survey |
| Australia | Australian Bureau of Statistics (ABS) | 4.5% (July 2026) | Monthly |
Notice that the UK reports a rolling three-month average rather than a single-month snapshot, which smooths out volatility but also means UK readers are always looking at slightly stale data compared to the U.S. release. Canada's headline rate running well above the U.S. and Australia doesn't necessarily mean its economy is in worse shape — definitions of who counts as "in the labor force," survey methodology, and seasonal adjustment techniques all differ by country, so comparing levels across borders is less useful than tracking the trend within your own country over time.
Common Mistakes to Avoid When Interpreting Jobs Data
- Reacting to the headline unemployment rate alone. As July showed, a falling rate can reflect people leaving the labor force rather than an improving job market.
- Ignoring revisions. The initial payroll number is an estimate; treat the two prior months' revisions as at least as important as this month's headline figure.
- Assuming one month sets a trend. A single weak report is noise; two or three consecutive months moving the same direction, plus consistent downward revisions, is a signal.
- Making large financial moves based on rate speculation. Betting on a specific Fed decision before it happens — refinancing early, timing a stock trade, locking a mortgage rate on a rumor — is a common way to lose money on a guess.
- Comparing your country's rate to another country's rate without adjusting for methodology. A 4.5% rate in Australia and a 4.9% rate in the UK aren't measuring identically defined populations.
Practical Tips If You're Worried About Your Own Job Right Now
If your sector shows up on the losing side of a report like July's, there are concrete moves that matter more than general anxiety. Talk to your manager candidly about the team's outlook if you have that kind of relationship — hiring freezes and restructuring plans are often visible internally well before layoffs are announced publicly. Review your severance and benefits policy now, while it's a hypothetical question rather than an urgent one; knowing your notice period, COBRA subsidy eligibility, and any equity vesting cliffs changes how you'd plan a transition.
It's also worth checking whether your unemployment insurance eligibility and benefit amount are current in your state or region, since rules and maximum weekly benefits change periodically and most people never check until they need to file. Finally, resist the urge to make dramatic portfolio changes based on a single jobs report — retirement accounts in particular are long-horizon investments, and one weak month of hiring data is not a reason to shift your 401(k), ISA, RRSP, or superannuation allocation.
Where to Find Reliable Employment Statistics
Skip aggregator headlines when you want the real numbers and go to the source:
- United States: bls.gov/news.release/empsit.htm for the monthly Employment Situation release
- United Kingdom: ons.gov.uk, Labour Market Overview bulletin
- Canada: statcan.gc.ca, "The Daily" Labour Force Survey release
- Australia: abs.gov.au, Labour Force, Australia release
- New Zealand and Western Europe: Stats NZ (stats.govt.nz) and Eurostat (ec.europa.eu/eurostat) publish comparable monthly and quarterly labour force releases
Bookmarking the release calendar for your country's statistics agency takes five minutes and means you're reading the primary data the same day it drops, rather than a secondhand summary that may already be a few news cycles removed from the original figures.