The cost of living in the United States varies dramatically depending on where you live. Two households earning the same income can have completely different lifestyles simply because of differences in housing, taxes, and everyday expenses.
Understanding the average cost of living by state—along with real statistics—helps you make better decisions about where to live, how much you need to earn, and how to plan your finances effectively.
What Is Cost of Living?
Cost of living refers to the total amount required to maintain a basic standard of living in a specific location. This includes housing, food, transportation, healthcare, and taxes.
It’s not just about how much you earn—it’s about how much you keep and can spend comfortably.
To understand how income fits into this:
Average Household Income in the USA – https://statush.com/finance-statistics/average-household-income-in-the-usa
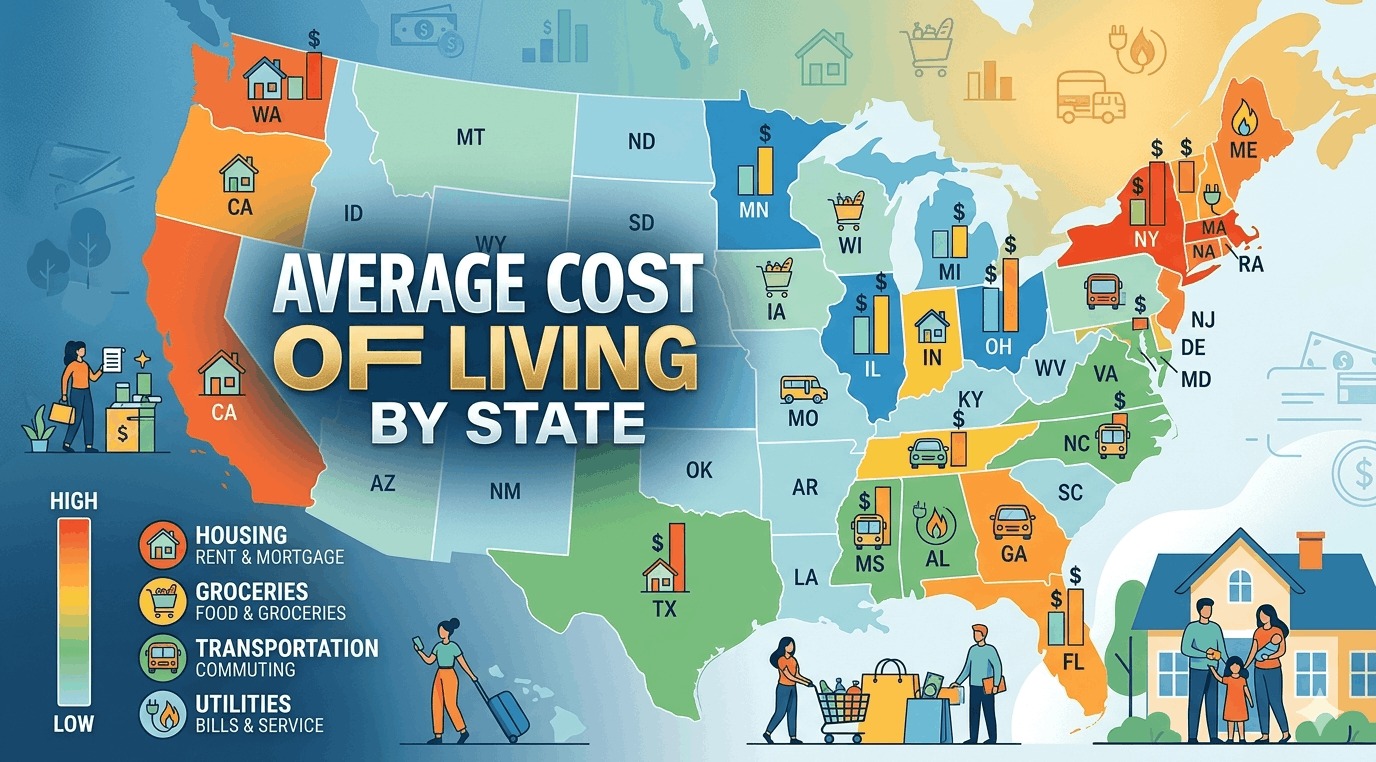
Key Components of Cost of Living
Cost of living is made up of several major expense categories. Each one contributes differently depending on the state.
| Expense Category | Typical Share of Budget | Explanation |
|---|---|---|
| Housing | 30%–40% | Rent or mortgage (largest cost) |
| Food | 10%–15% | Groceries and dining |
| Transportation | 10%–15% | Fuel, car payments, or public transit |
| Healthcare | 5%–10% | Insurance and medical costs |
| Taxes | Varies by state | Income and sales taxes |
Housing alone often determines whether a state is considered expensive or affordable.
Cost of Living Index by State (Sample Statistics)
The cost of living index compares states against the national average (100). Below are approximate values for selected states:
| State | Cost of Living Index | Relative Cost Level |
|---|---|---|
| California | 140–150 | Very High |
| New York | 130–140 | Very High |
| Hawaii | 170+ | Extremely High |
| Texas | 90–95 | Moderate |
| Florida | 100–105 | Near Average |
| Illinois | 95–100 | Moderate |
| Ohio | 85–90 | Lower |
| Georgia | 90–95 | Moderate |
| Mississippi | 80–85 | Very Low |
| Arkansas | 80–85 | Very Low |
What This Means
- A score of 120 means costs are 20% higher than the national average
- A score of 85 means costs are 15% lower
These differences can significantly impact your financial life.
Housing Costs by State (Key Driver)
Housing is the biggest factor behind cost differences.
| State | Avg Monthly Rent (Approx) | Home Price Trend |
|---|---|---|
| California | $2,500–$3,500 | Very high |
| New York | $2,500–$3,500 | Very high |
| Texas | $1,200–$1,800 | Moderate |
| Florida | $1,500–$2,200 | Rising |
| Ohio | $900–$1,400 | Affordable |
| Mississippi | $800–$1,200 | Very affordable |
Real-World Example
- Renting in California: ~$3,000/month
- Renting in Ohio: ~$1,200/month
That’s a $1,800 monthly difference, or over $20,000 per year.
To understand broader trends:
Housing Price Trends in the USA – https://statush.com/finance-statistics/housing-price-trends-in-the-usa
Taxes by State
Taxes play a major role in cost of living, especially income tax.
| State | State Income Tax | Impact on Take-Home Income |
|---|---|---|
| California | High | Lower take-home pay |
| New York | High | Lower take-home pay |
| Texas | None | Higher take-home pay |
| Florida | None | Higher take-home pay |
| Illinois | Flat tax | Moderate impact |
Example
A $100,000 salary:
- In California → lower net income after taxes
- In Texas → higher net income
This directly affects your lifestyle and savings potential.
Real-World Comparison
Let’s compare two households:
Household A (California)
- Income: $120,000
- Rent: $3,000/month
- High taxes and expenses
Household B (Texas)
- Income: $90,000
- Rent: $1,500/month
- No state income tax
Despite earning less, Household B may have more disposable income and savings.
Cost of Living and Financial Freedom
Cost of living directly impacts your ability to:
- Save money
- Invest
- Pay off debt
- Build wealth
Higher costs reduce financial flexibility, while lower costs can accelerate wealth building.
To understand this better:
How Taxes Impact Wealth Building – https://statush.com/finance-statistics/how-taxes-impact-wealth-building
Regional Trends
Across the U.S., cost patterns follow certain trends:
- West Coast & Northeast → Highest costs
- Midwest & South → More affordable
- Urban areas → More expensive than rural areas
This is largely driven by demand, job markets, and housing supply.
Tools to Plan Based on Location
Understanding cost differences is easier with financial tools.
- Paycheck Calculator – https://statush.com/paycheck-calculator
- Home Affordability Calculator – https://statush.com/home-affordability-calculator
- Savings Goal Calculator – https://statush.com/savings-goal-calculator
These tools help you adjust your financial plan based on your state.
A Practical Perspective
Instead of focusing only on averages, think about your personal situation.
Ask yourself:
- Does my income match my location’s cost of living?
- Am I able to save consistently?
- Would moving reduce my expenses significantly?
Sometimes, relocating can have a bigger impact than increasing income.
Final Thoughts
The average cost of living by state highlights a key reality: location plays a huge role in financial success.
The key takeaway is simple:
- Costs vary significantly across states
- Housing and taxes are the biggest factors
- Lower costs can improve financial freedom
When you understand these differences, you can make smarter decisions about where to live, how to budget, and how to build long-term wealth.