When most people think about investing, they usually focus on company fundamentals like revenue, earnings, or dividends. But there is another major investing approach that focuses less on business financials and more on stock price behavior itself.
That approach is called technical analysis.
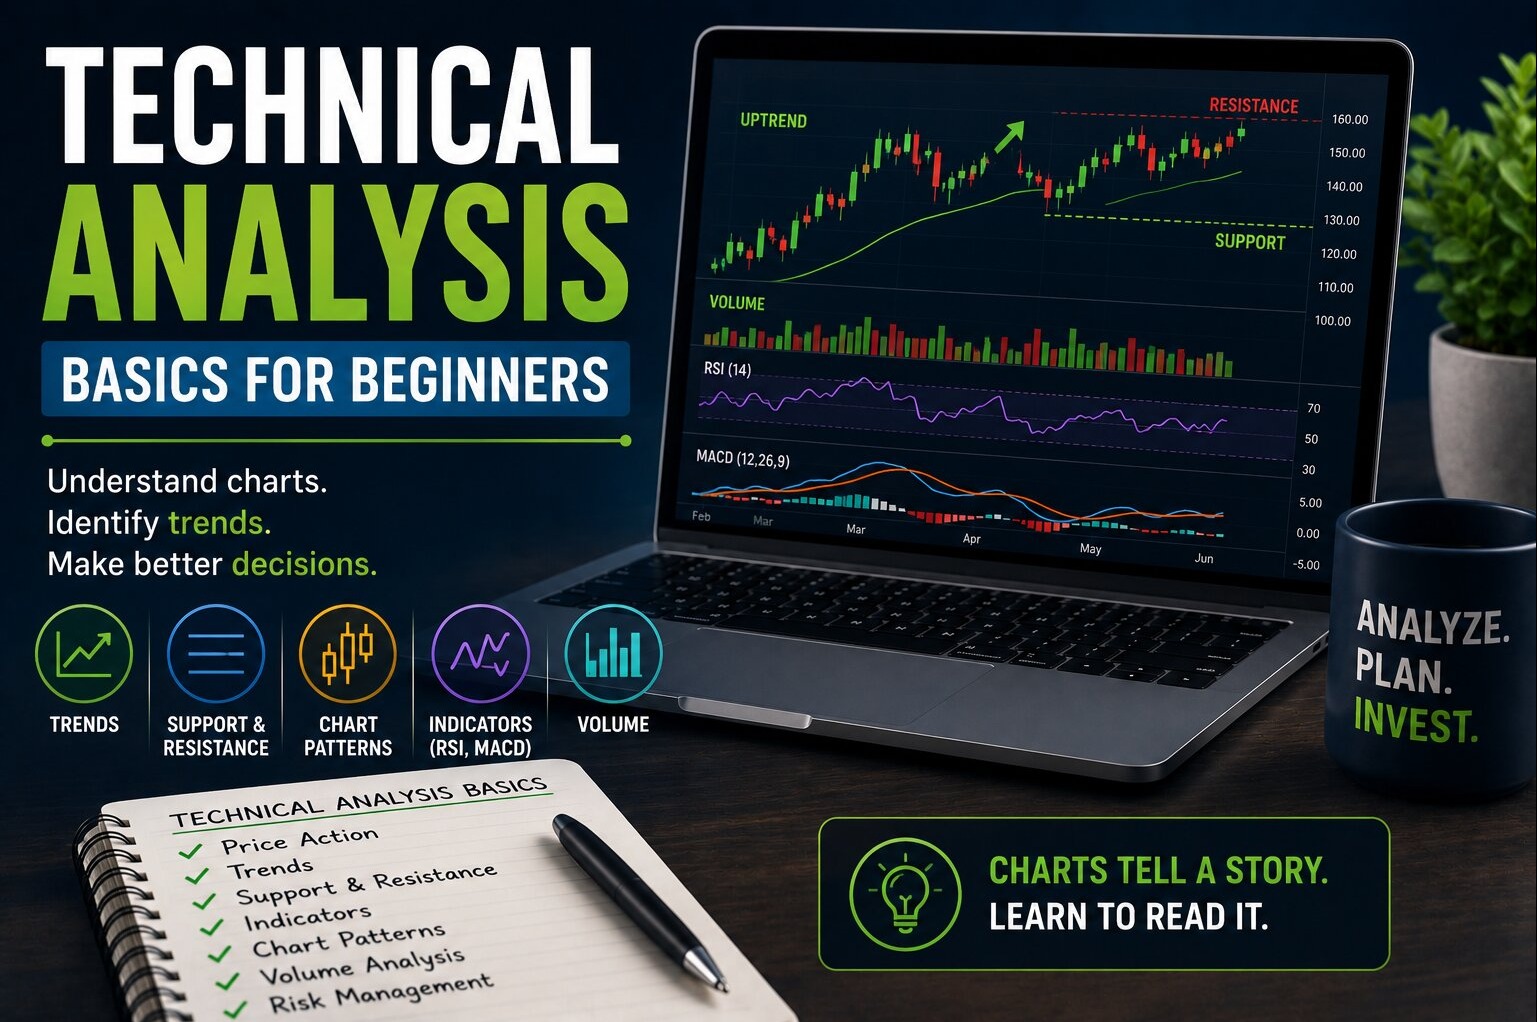
Technical analysis studies price charts, market trends, and trading activity to help investors identify potential buying and selling opportunities. Instead of analyzing a company’s financial statements, technical analysts focus on patterns, momentum, and market psychology.
For beginners, technical analysis can initially look overwhelming because charts often appear filled with lines, indicators, and strange patterns. But honestly, most successful traders rely mainly on a few basic concepts rather than dozens of complicated indicators.
The goal is not predicting markets perfectly. The goal is understanding trends, probabilities, and investor behavior more effectively.
What Is Technical Analysis?
Technical analysis is the study of historical price movements and trading volume to evaluate potential future market behavior.
Technical analysts believe:
- Market prices reflect available information
- Price trends often repeat
- Market psychology influences trading behavior
Instead of asking:
- “Is this company fundamentally strong?”
Technical analysis asks:
- “What is the market currently doing?”
This approach is commonly used for:
- Short-term trading
- Swing trading
- Momentum investing
- Entry and exit timing
Long-term investors sometimes use technical analysis too, especially for improving buy timing.
If you are more interested in business fundamentals, you may also want to read Fundamental Analysis for Beginner Investors.
Why Technical Analysis Matters
Markets are driven partly by emotions:
- Fear
- Greed
- Optimism
- Panic
These emotions often create recognizable price patterns over time.
Technical analysis helps traders:
- Identify trends
- Spot momentum shifts
- Manage risk
- Avoid emotional trading
While no method works perfectly, technical analysis gives investors structured ways to analyze market behavior instead of reacting randomly.
Understanding Stock Charts
Charts are the foundation of technical analysis.
The two most common chart types are:
- Line charts
- Candlestick charts
Line Charts
Line charts simply connect closing prices over time.
They are:
- Clean
- Easy to read
- Useful for identifying overall trends
Candlestick Charts
Candlestick charts provide more information, including:
- Opening price
- Closing price
- Highest price
- Lowest price
Each candlestick represents a specific time period:
- 1 minute
- 1 hour
- 1 day
- 1 week
Candlestick charts are widely used because they visually show buying and selling pressure.
Trends: The Core of Technical Analysis
One of the most important concepts in technical analysis is trend direction.
Markets generally move in three ways:
| Trend Type | Description |
|---|---|
| Uptrend | Higher highs and higher lows |
| Downtrend | Lower highs and lower lows |
| Sideways Trend | Prices move within a range |
Many traders follow a simple principle:
- Trade with the trend
- Avoid fighting strong momentum
Honestly, trend-following sounds simple, but many beginners struggle emotionally with it.
Support and Resistance
Support and resistance are key technical analysis concepts.
Support
Support is a price level where buying pressure tends to appear.
Prices often stop falling temporarily near support levels.
Resistance
Resistance is a price level where selling pressure tends to appear.
Prices often struggle to move higher near resistance levels.
Simple Example
| Level Type | Example |
|---|---|
| Support | Stock repeatedly bounces near $50 |
| Resistance | Stock repeatedly struggles near $70 |
These levels are not perfect prediction tools, but they help traders identify potential market behavior zones.
Moving Averages
Moving averages smooth price data to help identify trends more clearly.
A moving average calculates the average stock price over a set period.
Common examples:
- 20-day moving average
- 50-day moving average
- 200-day moving average
Moving Average Formula
\text{Moving Average} = \frac{\text{Sum of Prices Over Period}}{\text{Number of Periods}}
Why Traders Use Moving Averages
Moving averages help:
- Identify trends
- Reduce chart noise
- Spot momentum shifts
- Highlight support and resistance areas
For example:
- Price above moving average may suggest upward momentum
- Price below moving average may indicate weakness
Volume Analysis
Volume measures how many shares trade during a given period.
Volume is important because strong price moves supported by high volume are often viewed as more reliable.
Example
| Price Move | Volume | Interpretation |
|---|---|---|
| Stock rises sharply | High volume | Strong buying interest |
| Stock rises slightly | Low volume | Weaker conviction |
Technical traders often analyze price and volume together.
Relative Strength Index (RSI)
RSI is a momentum indicator that measures how quickly prices move.
RSI values typically range from 0 to 100.
General Interpretation
| RSI Level | Possible Meaning |
|---|---|
| Above 70 | Potentially overbought |
| Below 30 | Potentially oversold |
RSI is not a guarantee of reversals, but it can help traders identify extreme momentum conditions.
MACD Indicator
MACD stands for Moving Average Convergence Divergence.
It helps traders identify:
- Momentum direction
- Trend changes
- Potential buy or sell signals
Many beginners initially find MACD confusing, but the core idea is simply comparing moving averages to detect momentum shifts.
Candlestick Patterns
Technical traders often watch candlestick formations for potential market signals.
Common patterns include:
- Doji
- Hammer
- Engulfing patterns
- Shooting star
These patterns attempt to reflect changing market psychology.
For example:
- A hammer candlestick may suggest buyers regained control after selling pressure
However, candlestick patterns work best when combined with other analysis methods rather than used alone.
Chart Patterns
Technical analysis also studies larger chart structures.
Common patterns include:
- Head and shoulders
- Double top
- Double bottom
- Triangles
- Flags
These patterns attempt to identify:
- Trend continuation
- Potential reversals
- Breakout opportunities
At first, chart patterns can seem subjective, which is why beginners should avoid overcomplicating them.
Risk Management Matters Most
One important truth about technical analysis is that no indicator predicts markets perfectly.
This is why risk management is critical.
Successful traders often focus heavily on:
- Position sizing
- Stop-loss orders
- Risk-to-reward ratios
- Emotional discipline
Without risk management, even good analysis may fail during unexpected market moves.
You may also want to read How to Reduce Investment Risk.
Technical Analysis vs Fundamental Analysis
These approaches are often compared, but many investors actually use both.
Technical Analysis Focuses On:
- Price action
- Momentum
- Volume
- Trends
- Market psychology
Fundamental Analysis Focuses On:
- Revenue
- Earnings
- Valuation
- Business quality
- Financial health
Long-term investors often prioritize fundamentals while traders rely more heavily on technical analysis.
You can learn more in Fundamental Analysis for Beginner Investors.
Common Beginner Mistakes
Using Too Many Indicators
Beginners often overload charts with indicators until analysis becomes confusing.
In reality, simpler setups often work better.
Ignoring Risk Management
Even strong technical setups can fail unexpectedly.
Risk management is essential.
Trading Emotionally
Fear and greed often cause:
- Panic selling
- Chasing momentum
- Overtrading
Technical analysis should support disciplined decisions, not emotional reactions.
Expecting Certainty
Technical analysis works with probabilities, not guarantees.
No indicator predicts markets perfectly every time.
Long-Term Investors Can Still Benefit
Even if you are not an active trader, technical analysis can still help with:
- Entry timing
- Identifying strong trends
- Avoiding emotional buying
- Understanding market sentiment
Some long-term investors combine:
- Fundamental analysis for stock selection
- Technical analysis for timing decisions
That balanced approach can sometimes improve discipline.
Final Thoughts
Technical analysis helps investors and traders study market behavior through price action, trends, and trading activity.
For beginners, the most important concepts usually include:
- Trends
- Support and resistance
- Moving averages
- Volume analysis
- Risk management
At first, technical analysis may seem complicated because of the huge number of indicators and chart patterns available. But many experienced traders keep their systems surprisingly simple.
In many ways, successful technical analysis is less about finding a “perfect indicator” and more about developing discipline, managing risk, and understanding market psychology over time.